The Fe-Si phase diagram: from electrical steel to the planet Mercury
The Fe-Si phase diagram: from electrical steel to the planet Mercury
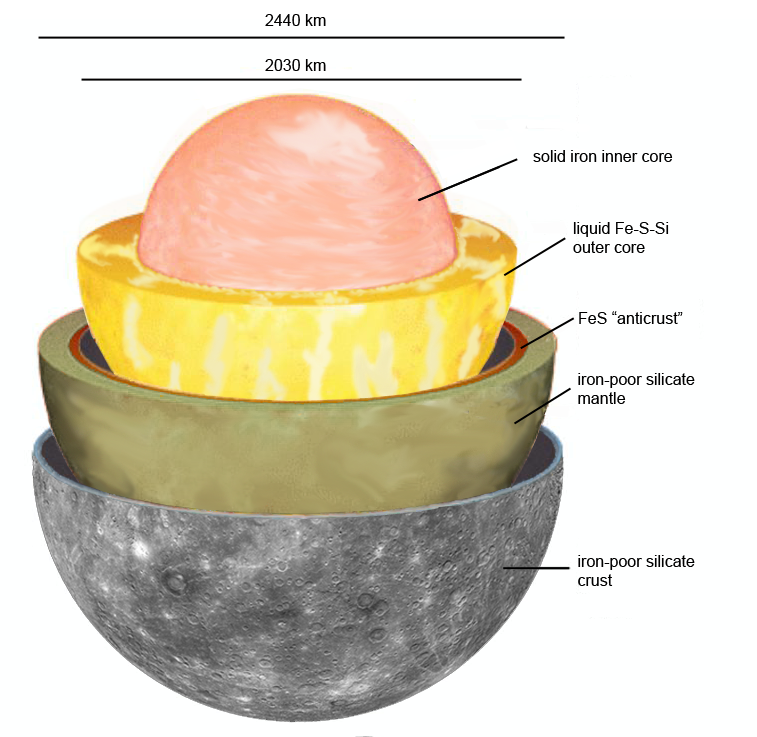
Promotor(en): S. Cottenier, T. Van Hoolst /18MAT07 / Solid-state physicsThe iron-rich region of the Fe-Si phase diagram is of interest both to the planetology community and the materials engineering community. Indeed, the planet Mercury has a solid inner core that consists predominantly of iron, with some nickel, and a selection of lighter elements. Mercury surface spectra and the thought formation conditions suggest that silicon could perhaps be the dominant light element [Nittler 2018, Fisher 2012]. Understanding in which phase this Fe-Si alloy appears – at the relevant pressure and temperature of the Mercury core – is mandatory before one can even attempt to predict important properties such as the elastic behavior of the core. In a very different context, iron-rich Fe-Si alloys are used as transformer cores. They are called ‘electrical steels’ for that reason (https://en.wikipedia.org/wiki/Electrical_steel). The ideal resistivity for this application is reached above 6 mass % of silicon, yet at that concentration the alloy is too brittle for cold rolling. Electrical steels in actual use have therefor only half of the ideal amount of silicon. Here too, understanding the phase diagram better is a route towards improving the properties (i.c. the silicon content) of electrical steels.
The standard phase diagram for Fe-Si is the one by Kubaschewski (1982). In the iron-rich region, the dominant phases are -Fe (0 at.% Si), DO3 (1, 25 at.% Si) and B20 (, 50 at.% Si). and 1 have the bcc lattice as underlying lattice, and 1 consists of an ordered replacement of one quarter of the Fe atoms by Si. The similarity between and 1 means that there is not a clear division between these two phases. Much of the confusion in the interpretation of this phase diagram is related to a lack of insight in the details of the long-range and short-range order of the Si-sublattice.
Goal
You will take a look at the Fe-Si phase diagram at the atomic scale. Density-functional theory – the work horse of computational materials physics – is ideally suited to inspect the stability of a systematic family of ordered silicon sublattices at several concentrations (we do have preliminary data that suggest that indeed stable phases are possible that have not yet been experimentally recognized). Once you have determined which phases in this family are stable, you will establish a new – predicted – phase diagram. This can be extended as a function of pressure, in the range relevant for the Mercury core. If time allows, you will perform phonon calculations to extend the phase diagram to the high temperatures relevant for the Mercury core. For those phases that appear to be relevant either for Mercury or for electrical steels, predictions of elastic properties will be performed. X-ray diffraction patterns can be predicted as well, to compare with experimental data. All computational methods required for this work, will be taught in the course ‘Computational Materials Physics’ (prerecorded lectures and hands-on tutorials are available at any time at www.compmatphys.org).
Aspects
Physics aspects: understanding phase stability at the atomic level, predicting planetary properties starting from the atomic scale
Engineering aspects: using phase diagram insight for materials optimization (here: increasing the Si content of electrical steel, without increasing brittleness)

- Study programmeMaster of Science in Engineering Physics [EMPHYS], Master of Science in Sustainable Materials Engineering [EMMAEN], Master of Science in Physics and Astronomy [CMFYST]ClustersFor Engineering Physics students, this thesis is closely related to the cluster(s) MATERIALS, MODELING, NANOKeywordsphase diagram, Fe-Si, planet Mercury, electrical steel, density-functional theoryReferences
Default Fe-Si phase diagram: O. Kubaschewski, Iron-binary Phase Diagrams, Springer-Verlag, Berlin, 1982
More recent phase diagram work: https://arxiv.org/pdf/1709.08306.pdf
A good description of the relevant phases: Sec. 1.3 of http://revistademetalurgia.revistas.csic.es/index.php/revistademetalurgi...
Fe-Si as core material for Mercury:
R. A. Fischer et al., Earth and Planetary Science Letters 357–358 (2012) 268–276, http://dx.doi.org/10.1016/j.epsl.2012.09.022
L.R. Nittler et al., ‘the chemical composition of Mercury’, https://arxiv.org/ftp/arxiv/papers/1712/1712.02187.pdf